Note
Click here to download the full example code
Scoring Time Series Estimators
This examples demonstrates some of the caveats / issues when trying to calculate performance scores for time series estimators.
This pipeline has been designed to evaluate performance using segments (not series’) as instances of the data.
# Author: David Burns
# License: BSD


import itertools

import matplotlib.pyplot as plt
import numpy as np
import pandas as pd
from sklearn.ensemble import RandomForestClassifier
from sklearn.metrics import f1_score, confusion_matrix, make_scorer
from sklearn.model_selection import train_test_split, cross_validate
from sklearn.pipeline import Pipeline
from sklearn.preprocessing import StandardScaler

from seglearn.datasets import load_watch
from seglearn.pipe import Pype
from seglearn.transform import FeatureRep, Segment
CONFUSION PLOT
def plot_confusion_matrix(cm, classes,
                          normalize=True,
                          cmap=plt.cm.Blues):
    """ plots confusion matrix """
    if normalize:
        cm = cm.astype('float') / cm.sum(axis=1)[:, np.newaxis]
    plt.imshow(cm, interpolation='nearest', cmap=cmap)
    plt.colorbar()
    tick_marks = np.arange(len(classes))
    plt.xticks(tick_marks, classes, rotation=45)
    plt.yticks(tick_marks, classes)
    fmt = '.2f' if normalize else 'd'
    thresh = cm.max() / 2.
    for i, j in itertools.product(range(cm.shape[0]), range(cm.shape[1])):
        plt.text(j, i, format(cm[i, j], fmt),
                 horizontalalignment="center",
                 color="white" if cm[i, j] > thresh else "black")

    plt.ylabel('True label')
    plt.xlabel('Predicted label')
    plt.tight_layout()
SETUP
# load the data
data = load_watch()
X = data['X']
y = data['y']

# create a feature representation pipeline
steps = [('seg', Segment()),
         ('features', FeatureRep()),
         ('scaler', StandardScaler()),
         ('rf', RandomForestClassifier(n_estimators=20))]

pipe = Pype(steps)

# split the data
X_train, X_test, y_train, y_test = train_test_split(X, y, test_size=0.25, random_state=42)
OPTION 1: Use the score SegPipe score method
pipe.fit(X_train, y_train)
score = pipe.score(X_test, y_test)
print("Accuracy score: ", score)
Out:
Accuracy score: 0.7556131260794473
OPTION 2: generate true and predicted target values for the segments
y_true, y_pred = pipe.transform_predict(X_test, y_test)
# use any of the sklearn scorers
f1_macro = f1_score(y_true, y_pred, average='macro')
print("F1 score: ", f1_macro)

cm = confusion_matrix(y_true, y_pred)
plot_confusion_matrix(cm, data['y_labels'])
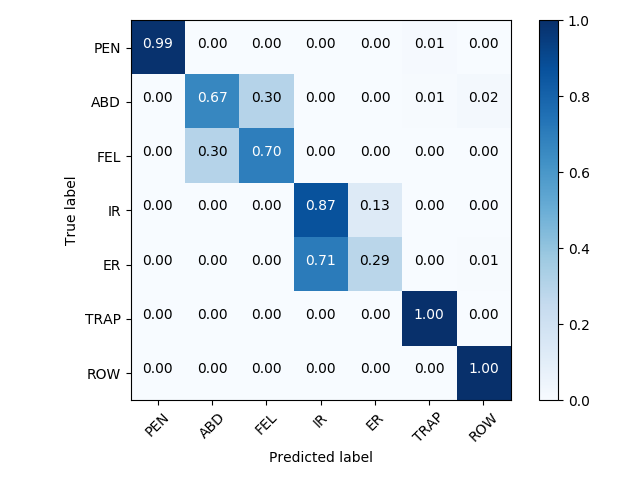
Out:
F1 score: 0.7683103625934831
OPTION 3: scoring during model selection
# model selection using the built-in score method for the final estimator
cv_scores = cross_validate(pipe, X, y, cv=4, return_train_score=True)
print("CV Scores: ", pd.DataFrame(cv_scores))

# model selection with scoring functions / dictionaries
#
# unfortunately, this is not possible withing the current framework due to how
# scoring is implemented within the model_selection functions / classes of sklearn
# running the code below will cause an error, because the model_selection
# functions / classes do not have access to y_true for the segments
#
# >>> scoring = ['accuracy','precision_macro','recall_macro','f1_macro']
# >>> cv_scores = cross_validate(pipe, X, y, cv = 4, return_train_score=True, scoring=scoring)
#
# workarounds for this issue are outlined below
Out:
CV Scores:     fit_time  score_time  test_score  train_score
0  0.446275    0.076087    0.784972     0.999708
1  0.502541    0.079094    0.842857     1.000000
2  0.466788    0.069131    0.774956     1.000000
3  0.431198    0.071541    0.770619     1.000000
SCORING WORKAROUND 1: USE ANOTHER SCORER FUNCTION
# ``SegPipe`` can be initialized with a scorer callable made with sklearn.metrics.make_scorer
# this can be used to cross_validate or grid search with any 1 score

scorer = make_scorer(f1_score, average='macro')
pipe = Pype(steps, scorer=scorer)
cv_scores = cross_validate(pipe, X, y, cv=4, return_train_score=True)
print("CV F1 Scores: ", pd.DataFrame(cv_scores))
Out:
CV F1 Scores:     fit_time  score_time  test_score  train_score
0  0.431416    0.073237    0.824988          1.0
1  0.467504    0.068295    0.841483          1.0
2  0.446201    0.069201    0.791326          1.0
3  0.435928    0.070309    0.797336          1.0
SCORING WORKAROUND 2: WORK OUTSIDE THE PIPELINE
# If you want to have multiple score computed, the only way is as follows
#
# First transform the time series data into segments and then use an sklearn Pipeline
#
# The disadvantage of this is that the parameters of the segmentation cannot be
# optimized with this approach

segmenter = Segment()
X_seg, y_seg, _ = segmenter.fit_transform(X, y)

clf = Pipeline([('features', FeatureRep()),
                ('scaler', StandardScaler()),
                ('rf', RandomForestClassifier())])

scoring = ['accuracy', 'precision_macro', 'recall_macro', 'f1_macro']
cv_scores = cross_validate(clf, X_seg, y_seg,
                           cv=4, return_train_score=False, scoring=scoring)
print("CV Scores (workaround): ", pd.DataFrame(cv_scores))
Out:
CV Scores (workaround):     fit_time  score_time  test_accuracy  test_precision_macro  test_recall_macro  test_f1_macro
0  1.312680    0.081219       0.813675              0.829951           0.827524       0.823218
1  1.308434    0.079772       0.816082              0.840500           0.834377       0.831517
2  1.313067    0.081143       0.810950              0.838272           0.820251       0.822046
3  1.310060    0.090736       0.799829              0.822963           0.818255       0.816566
Total running time of the script: ( 0 minutes 12.474 seconds)