Note
Click here to download the full example code
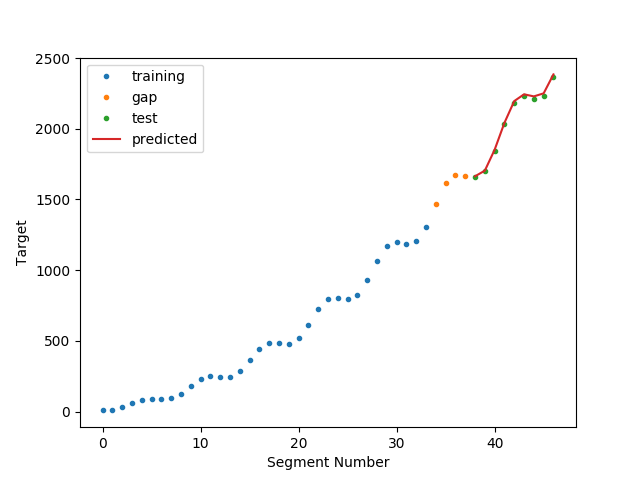
Time Series Forecasting
In this example, we use a feature representation pipeline to forecast a continuous time series target with a regressor.
The algorithm is trained from the target from the features and targets in the training set. Then predict (future segments) from the features in the test set.
We do not sequentially retrain the algorithm as we move through the test set - which is an approach you will sometimes see with time series forecasting (and which may or may not be useful in your application).
Out:
N series in train:  1
N series in test:  1
N segments in train:  34
N segments in test:  9
Score:  0.9969665116177244
/home/david/Code/seglearn/examples/plot_forecast.py:84: UserWarning: Matplotlib is currently using agg, which is a non-GUI backend, so cannot show the figure.
  plt.show()
# Author: David Burns
# License: BSD


import matplotlib.pyplot as plt
import numpy as np
from sklearn.linear_model import LinearRegression

from seglearn.pipe import Pype
from seglearn.split import temporal_split
from seglearn.transform import FeatureRep, SegmentXYForecast, last

t = np.arange(5000) / 100.
y = np.sin(t) * t * 2.5 + t * t

# with forecasting, X can include the target
X = np.stack([t, y], axis=1)

# remember for a single time series, we need to make a list
X = [X]
y = [y]

# split the data along the time axis (our only option since we have only 1 time series)
X_train, X_test, y_train, y_test = temporal_split(X, y, test_size=0.25)

# create a feature representation pipeline
# setting y_func = last, and forecast = 200 makes us predict the value of y
# 200 samples ahead of the segment
# other reasonable options for y_func are ``mean``, ``all`` (or create your own function)
# see the API documentation for further details
clf = Pype([('segment', SegmentXYForecast(width=200, overlap=0.5, y_func=last, forecast=200)),
            ('features', FeatureRep()),
            ('lin', LinearRegression())])

# fit and score
clf.fit(X_train, y_train)
score = clf.score(X_test, y_test)

print("N series in train: ", len(X_train))
print("N series in test: ", len(X_test))
print("N segments in train: ", clf.N_train)
print("N segments in test: ", clf.N_test)
print("Score: ", score)

# generate some predictions
y, y_p = clf.transform_predict(X, y)  # all predictions
ytr, ytr_p = clf.transform_predict(X_train, y_train)  # training predictions
yte, yte_p = clf.transform_predict(X_test, y_test)  # test predictions

# note - the first few segments in the test set won't have predictions (gap)
# we plot the 'gap' for the visualization to hopefully make the situation clear
Ns = len(y)
ts = np.arange(Ns)  # segment number
ttr = ts[0:len(ytr)]
tte = ts[(Ns - len(yte)):Ns]
tga = ts[len(ytr):(Ns - len(yte))]
yga = y[len(ytr):(Ns - len(yte))]

# plot the results
plt.plot(ttr, ytr, '.', label="training")
plt.plot(tga, yga, '.', label="gap")
plt.plot(tte, yte, '.', label="test")
plt.plot(tte, yte_p, label="predicted")

plt.xlabel("Segment Number")
plt.ylabel("Target")
plt.legend()
plt.show()
Total running time of the script: ( 0 minutes 0.089 seconds)