Note
Click here to download the full example code
Continuous Target and Time Series Regression
In this example, we use the pipeline to learn a continuous time series target with a regressor
Out:
N series in train: 1
N series in test: 1
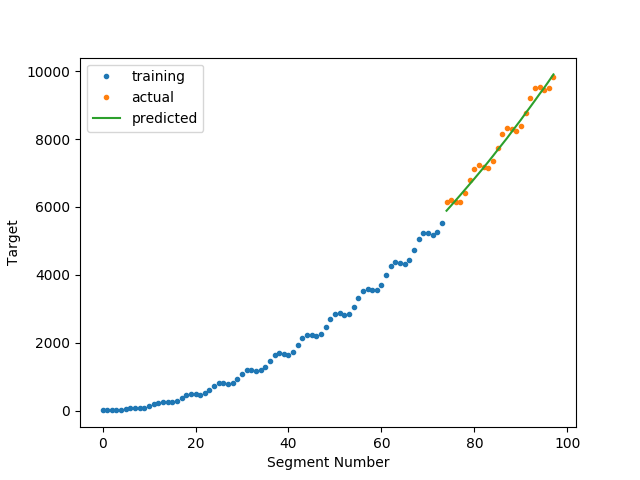
N segments in train: 74
N segments in test: 24
Score: 0.973886266451577
/home/david/Code/seglearn/examples/plot_regression.py:61: UserWarning: Matplotlib is currently using agg, which is a non-GUI backend, so cannot show the figure.
plt.show()
# Author: David Burns
# License: BSD


import matplotlib.pyplot as plt
import numpy as np
import pandas as pd
from sklearn.linear_model import LinearRegression
from sklearn.model_selection import cross_validate

from seglearn.pipe import Pype
from seglearn.split import temporal_split, TemporalKFold
from seglearn.transform import FeatureRep, Segment, last

# for a single time series, we need to make it a list
X = [np.arange(10000) / 100.]
y = [np.sin(X[0]) * X[0] * 3 + X[0] * X[0]]

# split the data along the time axis (our only option since we have only 1 time series)
X_train, X_test, y_train, y_test = temporal_split(X, y)

# setting y_func = last, selects the last value from each y segment as the target
# other options include transform.middle, or you can make your own function
# see the API documentation for further details

pipe = Pype([('seg', Segment(width=200, overlap=0.5, y_func=last)),
             ('features', FeatureRep()),
             ('lin', LinearRegression())])

# fit and score
pipe.fit(X_train, y_train)
score = pipe.score(X_test, y_test)

print("N series in train: ", len(X_train))
print("N series in test: ", len(X_test))
print("N segments in train: ", pipe.N_train)
print("N segments in test: ", pipe.N_test)
print("Score: ", score)

# generate some predictions
ytr, ytr_p = pipe.transform_predict(X_train, y_train)  # training predictions
yte, yte_p = pipe.transform_predict(X_test, y_test)  # test predictions
xtr = np.arange(len(ytr))  # segment number
xte = np.arange(len(yte)) + len(xtr)

# plot the amazing results
plt.plot(xtr, ytr, '.', label="training")
plt.plot(xte, yte, '.', label="actual")
plt.plot(xte, yte_p, label="predicted")
plt.xlabel("Segment Number")
plt.ylabel("Target")
plt.legend()
plt.show()

# # now try a cross validation
# X = [np.arange(4000) / 100.]
# y = [np.sin(X[0])]
#
# tkf = TemporalKFold()
# X, y, cv = tkf.split(X, y)
# cv_scores = cross_validate(pipe, X, y, cv=cv, return_train_score=True)
# print("CV Scores: ", pd.DataFrame(cv_scores))
Total running time of the script: ( 0 minutes 0.077 seconds)