Note
Click here to download the full example code
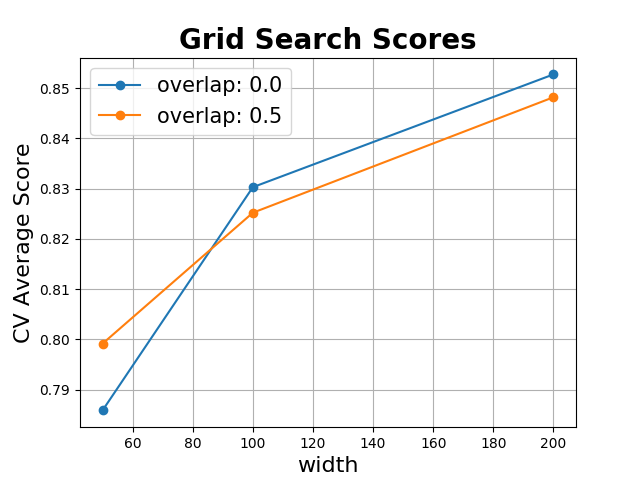
Hyperparameter Selection 1
This example demonstrates how to do model selection in a feature representation pipeline using a grid search
Out:
/home/david/Code/seglearn/examples/plot_model_selection1.py:72: UserWarning: Matplotlib is currently using agg, which is a non-GUI backend, so cannot show the figure.
  plt.show()
# Author: David Burns
# License: BSD

import matplotlib.pyplot as plt
import numpy as np
from sklearn.ensemble import RandomForestClassifier
from sklearn.model_selection import GridSearchCV, GroupKFold
from sklearn.preprocessing import StandardScaler

import seglearn as sgl


def plot_grid_search(cv_results, grid_param_1, grid_param_2, name_param_1, name_param_2):
    # plotting grid results from David Alvarez on Stack Overflow

    # Get Test Scores Mean and std for each grid search
    scores_mean = cv_results['mean_test_score']
    scores_mean = np.array(scores_mean).reshape(len(grid_param_2), len(grid_param_1))
    scores_sd = cv_results['std_test_score']
    scores_sd = np.array(scores_sd).reshape(len(grid_param_2), len(grid_param_1))

    # Plot Grid search scores
    _, ax = plt.subplots(1, 1)

    # Param1 is the X-axis, Param 2 is represented as a different curve (color line)
    for idx, val in enumerate(grid_param_2):
        ax.plot(grid_param_1, scores_mean[idx, :], '-o', label=name_param_2 + ': ' + str(val))

    ax.set_title("Grid Search Scores", fontsize=20, fontweight='bold')
    ax.set_xlabel(name_param_1, fontsize=16)
    ax.set_ylabel('CV Average Score', fontsize=16)
    ax.legend(loc="best", fontsize=15)
    ax.grid(True)


# load the data
data = sgl.load_watch()
X = data['X']
y = data['y']
g = data['subject']

# use subject id to group folds
splitter = GroupKFold(n_splits=3)
cv = splitter.split(X, y, groups=g)

# create a feature representation pipeline
pipe = sgl.Pype([('seg', sgl.Segment()),
                 ('features', sgl.FeatureRep()),
                 ('scaler', StandardScaler()),
                 ('rf', RandomForestClassifier())])

# create a parameter dictionary using the sklearn API
# note that if you want to set a parameter to a single value, it will still need to be as a list

par_grid = {'seg__width': [50, 100, 200],
            'seg__overlap': [0., 0.5],
            'rf__n_estimators': [20]}

clf = GridSearchCV(pipe, par_grid, cv=cv)
clf.fit(X, y)

plot_grid_search(clf.cv_results_, par_grid['seg__width'],
                 par_grid['seg__overlap'], 'width', 'overlap')
plt.show()
Total running time of the script: ( 0 minutes 8.050 seconds)