Note
Click here to download the full example code
Plotting Neural Network Training Curves
This is a basic example using a convolutional recurrent neural network to learn segments directly from time series data
# Author: David Burns
# License: BSD

import matplotlib.pyplot as plt
import numpy as np
from tensorflow.python.keras.layers import Dense, LSTM, Conv1D
from tensorflow.python.keras.models import Sequential
from tensorflow.python.keras.wrappers.scikit_learn import KerasClassifier
from pandas import DataFrame
from sklearn.model_selection import train_test_split

from seglearn.datasets import load_watch
from seglearn.pipe import Pype
from seglearn.transform import Segment
Simple NN Model
def crnn_model(width=100, n_vars=6, n_classes=7, conv_kernel_size=5,
               conv_filters=3, lstm_units=3):
    input_shape = (width, n_vars)
    model = Sequential()
    model.add(Conv1D(filters=conv_filters, kernel_size=conv_kernel_size,
                     padding='valid', activation='relu', input_shape=input_shape))
    model.add(LSTM(units=lstm_units, dropout=0.1, recurrent_dropout=0.1))
    model.add(Dense(n_classes, activation="softmax"))

    model.compile(loss='categorical_crossentropy', optimizer='adam',
                  metrics=['accuracy'])

    return model
Setup
# load the data
data = load_watch()
X = data['X']
y = data['y']

# split the data
X_train, X_test, y_train, y_test = train_test_split(X, y, test_size=0.25, random_state=42)

# create a segment learning pipeline
pipe = Pype([('seg', Segment(width=100, step=100, order='C')),
             ('crnn', KerasClassifier(build_fn=crnn_model, epochs=4, batch_size=256,
                                      verbose=0, validation_split=0.2))])
Accessing training history
# this is a bit of a hack, because history object is returned by the
# keras wrapper when fit is called
# this approach won't work with a more complex estimator pipeline, in which case
# a callable class with the desired properties should be made passed to build_fn

pipe.fit(X_train, y_train)
history = pipe.history.history
print(DataFrame(history))

# depends on version
if 'accuracy' in history:
    ac_train = history['accuracy']
    ac_val = history['val_accuracy']
elif 'acc' in history:
    ac_train = history['acc']
    ac_val = history['val_acc']
else:
    raise ValueError("History object doesn't contain accuracy record")

epoch = np.arange(len(ac_train)) + 1
Out:
       loss  accuracy  val_loss  val_accuracy
0  1.957218  0.184432  1.948542      0.047619
1  1.950467  0.192847  1.946699      0.036415
2  1.943282  0.189341  1.944778      0.028011
3  1.937308  0.205470  1.943990      0.022409
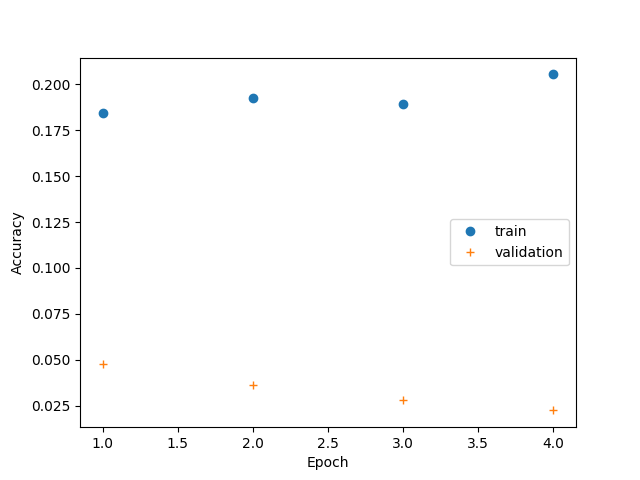
Training Curves
plt.plot(epoch, ac_train, 'o', label="train")
plt.plot(epoch, ac_val, '+', label="validation")
plt.xlabel("Epoch")
plt.ylabel("Accuracy")
plt.legend()
plt.show()
Out:
/home/david/Code/seglearn/examples/plot_nn_training_curves.py:96: UserWarning: Matplotlib is currently using agg, which is a non-GUI backend, so cannot show the figure.
  plt.show()
Total running time of the script: ( 0 minutes 3.716 seconds)